
Market Watch
Pick two places and the equipment. See what the lane pays today and how it has moved over the last 30 days.
How it works
Choose the origin and the destination, and how wide an area around each city to include.
The trailer type you are pricing for.
See the rate for each time window and a 30-day chart of the rate per mile.
Use the lane to post a load or post a truck, without typing it all again.
Watch
Video coming soon
We are preparing this video. Check back soon.
What you get
Swap the origin and destination with one tap to price the return trip.
Widen or narrow the area so the figure reflects the real market.
The trip average and the rate per mile for each window, side by side.
See the lane’s rate per mile over the last 30 days with the headline marked.
Lanes your company priced are listed, and opening one shows its result again at no charge.
Post a load or a truck on the lane you just looked at.
Carry the lane over to the form you need.
Everyone with rate access sees the lanes the company has priced.
Reading it
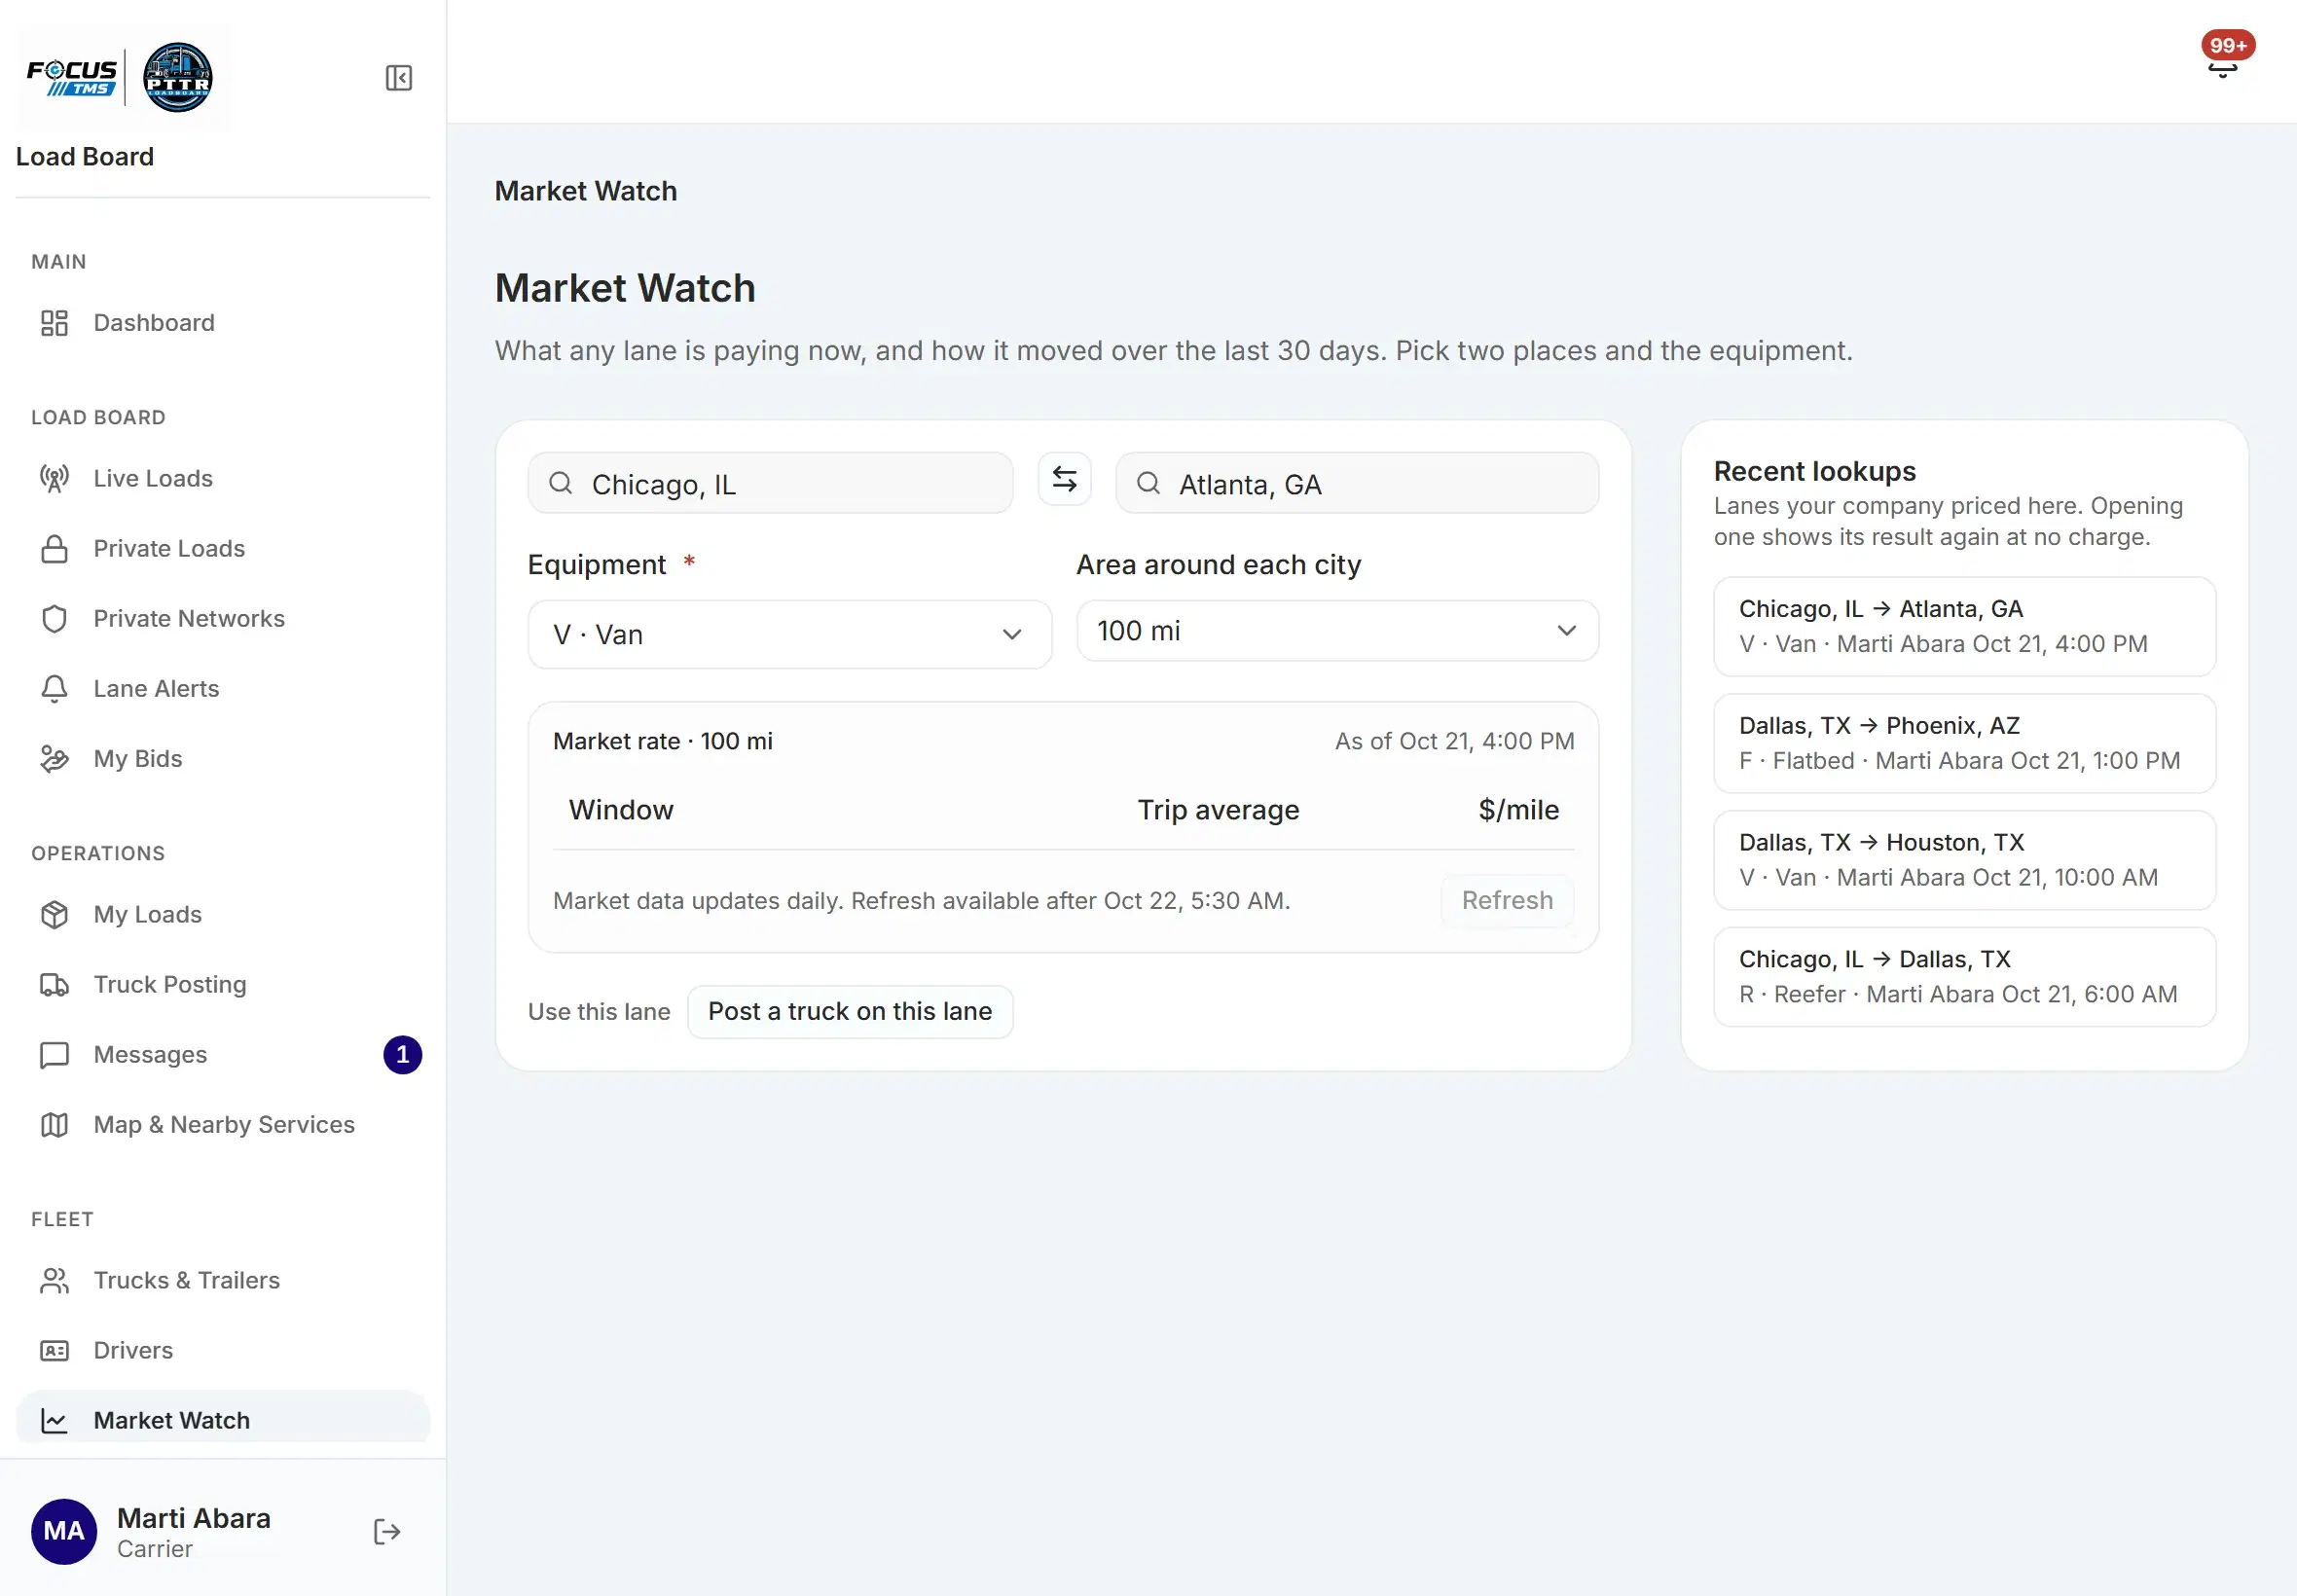
| Column | What it shows |
|---|---|
| Window | The period: last 24 hours, 3 days, 7 days, 30 days, 2 months or 4 months. |
| Trip average | The average total paid for a trip on the lane in that window. |
| Rate per mile | The average paid per mile in that window. |
| Headline | The main per-mile figure for the lane. |
| No data | Shown when a window does not have enough loads to give a figure. |
Who uses it
What it means for you
See the trend, not just today
A rising or falling lane shows in the chart before it shows in your rate.
Fewer second guesses
The lane you looked at carries straight into the form.
Shared by your team
Recent lookups are listed, so no one pays twice for the same lane.
Good to know
More from Intelligence
Create an account and start with the lanes you run.